Cell visualization (Visualizer)
Warning
Before editing this tab, you must first configure the Color schemes tab.
This section sets the conditions under which certain color schemes specified in the Color schemes tab are applied to the cell.
Note
These conditions can also be set through Java code in the Model Report tab by selecting the Custom visualizer option and specifying the path in the repository to the desired file.
To add and remove conditions for applying color schemes, use the  and
and  buttons, respectively.
For each condition, you can configure the following parameters:
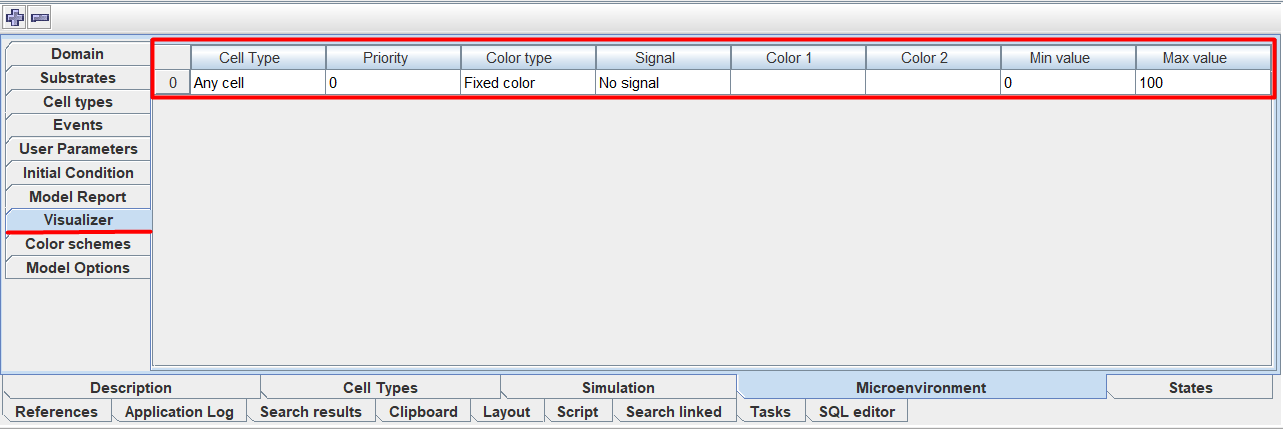
Cell Type: the cell type to which the condition will be applied.
Priority: priority for applying this condition.
Color type: rule for applying a color scheme.
Signal: cell property whose values are applied in the condition.
Color 1: 1st color scheme.
Color 2: 2nd color scheme.
Min value: the minimum value of the selected cell property (Signal).
Max value: the maximum value of the selected cell property (Signal).
The Cell Type, Color type, Signal, Color 1, and Color 2 field values are selected from the drop-down lists.
To set the values of the Priority, Min value, and Max value fields, you need to click LMB under the corresponding heading and enter your own value.
Particular attention should be paid to the rules for using color schemes (Color type). There are 4 rules in total:
Fixed color: only one color scheme is always applied, specified in the Color 1 field (the Color 2 field becomes inactive when such a rule is selected).
Gradient: the color of the cell changes along a gradient from the 1st color scheme (Color 1) to the 2nd (Color 2) depending on the value of the selected cell property (Signal) relative to the minimum (Min value) and maximum (Max value).
Larger than max: if the cell property value (Siganl) is greater than the maximum (Max value), then the 1st color scheme (Color 1) is applied to the cell; in all other cases, the 2nd color scheme (Color 2) is used.
Smaller than min: if the value of the cell’s property (Siganl) is less than the minimum (Min value), then the 1st color scheme (Color 1) is applied to the cell; in all other cases, the 2nd color scheme (Color 2) is used.
Note
The Priority field is used only for the Larger than max and Smaller than min rules.
If at some point in time several conditions with these types of rules are applied simultaneously to the same type of cells, then the one that has the lowest value in the Priority field will be executed.
Below is an example of how different rules for applying color schemes work with the following settings:
Color 1:
 .
.Color 2:
 .
.Min value: 10.
Max value: 100.
Rule |
Signal = 0 |
Signal = 50 |
Signal = 200 |
|---|---|---|---|
Fixed color |
|
|
|
Gradient |
|
|
|
Larger than max |
|
|
|
Smaller than min |
|
|
|
